Posts Tagged ‘data’

Econometrics is…

Wednesday, July 27th, 2011

Econometrics is the use of mathematics and computing to analyze economic questions. Someone who does econometrics is called an “econometrician.” Yup.

Econometricians use models (like linear regression) to achieve a number of goals. These include:

  • generating economic data
  • answering a particular question
  • testing a theory
  • discovering an economic relationship

As Seen on the Web… Money, Health, and One Crazy Statistician

Thursday, March 3rd, 2011

Seriously, we’ve never been so excited to watch someone talk about statistics.

In just four minutes, learn everything you need to know about the relationship between income and lifespan, and how the wildly the world has changed since 1810. Very cool.

What the Unemployment Rate Really Means

Wednesday, March 2nd, 2011

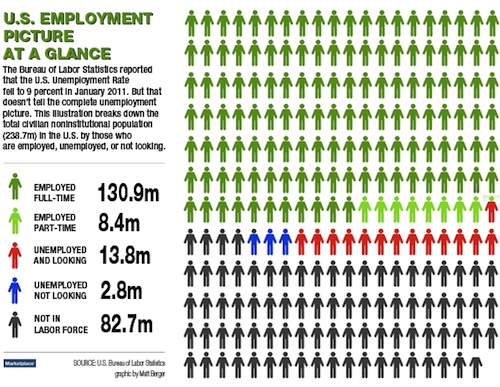
When they say the U.S. unemployment rate is 9%, does that mean that only 9% of all possible American workers are out of a job?

Nope. The official unemployment rate doesn’t count people who have given up looking for a job. It also doesn’t include people considered “not in the labor force,” like students. And it definitely doesn’t tell you much about the millions of people who are working part-time but can’t find full-time work. (They’re called the “underemployed.”)

Contrary to popular belief, the unemployment rate has nothing to do with how many people are applying for or receiving unemployment benefits. The Bureau of Labor Statistics collects data by actually going out and asking people about their employment status.

Click the chart for Matt Berger’s explanation.

How do you fit into this chart?

What An “Advanced Economy” Really Looks Like

Thursday, February 24th, 2011

“It’s time for us to stop lying to ourselves about this country.

America is great in many ways, but on a whole host of measures — some of which are shown in the accompanying chart — we have become the laggards of the industrialized world. Not only are we not No. 1 — “U.S.A.! U.S.A.!” — we are among the worst of the worst.” (from the original opinion piece)

Click here to see the chart.

What do you think?

Are we as bad as the chart says? Where do you see room for improvement?

How can you, as a philanthropist, help the U.S. improve its standing?

Even if Mom is still doing your laundry, you can always make graphs

Tuesday, February 22nd, 2011

Even if the graphs are, oh, maybe just a little misleading. Take this one, for example. It appears to say that the reason certain European countries are in worse financial shape than others is because more of their men want to stay at home playing videogames.

See? Italy, Greece, Spain, and Portugal are over there on the right, with more of their menfolk living with the parents. And, conveniently, those same countries rank high on the riskiness (a.k.a. sovereign risk) of their government bonds (a.k.a. sovereign debt).
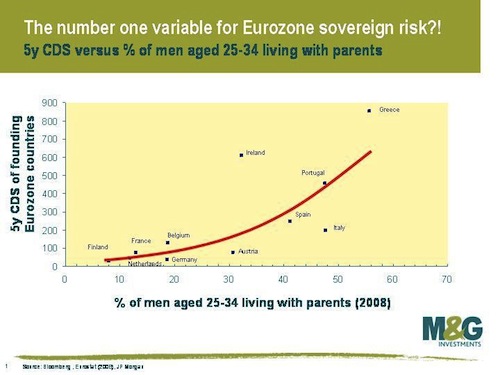
If he lives with his parents, you might want to think twice. About buying his government’s debt. (via The Economist)

But in case your statistics teacher hasn’t drilled this into your heads yet, correlation is not causation. This is a real-world example of that. Just because you can make a chart with a nice line on it doesn’t necessarily mean that one factor causes the other. Think about this:

  • The % of men living with their parents may be another way of describing the % of men who are unemployed (or underemployed). That would certainly be a factor in a country’s financial health.
  • Adult kids living with their folks might be due to a really expensive housing market, which is another factor in a country’s financial situation.
  • The countries with the highest % of men living with their parents all have cultural traditions that encourage kids to stay with their parents until they marry, or sometimes even after.
  • Ireland doesn’t have this culture of stay-at-home-til-you’re-40, but their bonds are still considered risky investments. If you just focus on the red line, you might miss this important point.

In conclusion:

  1. Correlation is not causation
  2. Think before you reblog
  3. If you can’t do either of those things, at least read the comments
Other Countries Outpacing U.S. in Internet Tomfoolery

Monday, December 27th, 2010

Check this out. It’s a crazy interactive site showing you how different countries/ regions around the world compare when it comes to digital adventures.

Which country do you think does the most online shopping?

discoverdigitallife.png

Fun facts!

  • Hong Kong is totally beating everyone at Angry Birds
  • South Korea and Vietnam are shopping online when the boss isn’t looking
  • Residents of China and Singapore all have a part-time job, and that job is surfing the Internet
  • Everyone in Brazil and Malaysia has more Facebook friends than you